

Dashboards
A dashboard is a board of widgets over your tables: numbers, charts, rankings, text and pictures. Widgets bound to a table refresh from it, so the board keeps showing the current state instead of a snapshot. You can build a dashboard by hand, let AI propose one, or ask chat to change it.
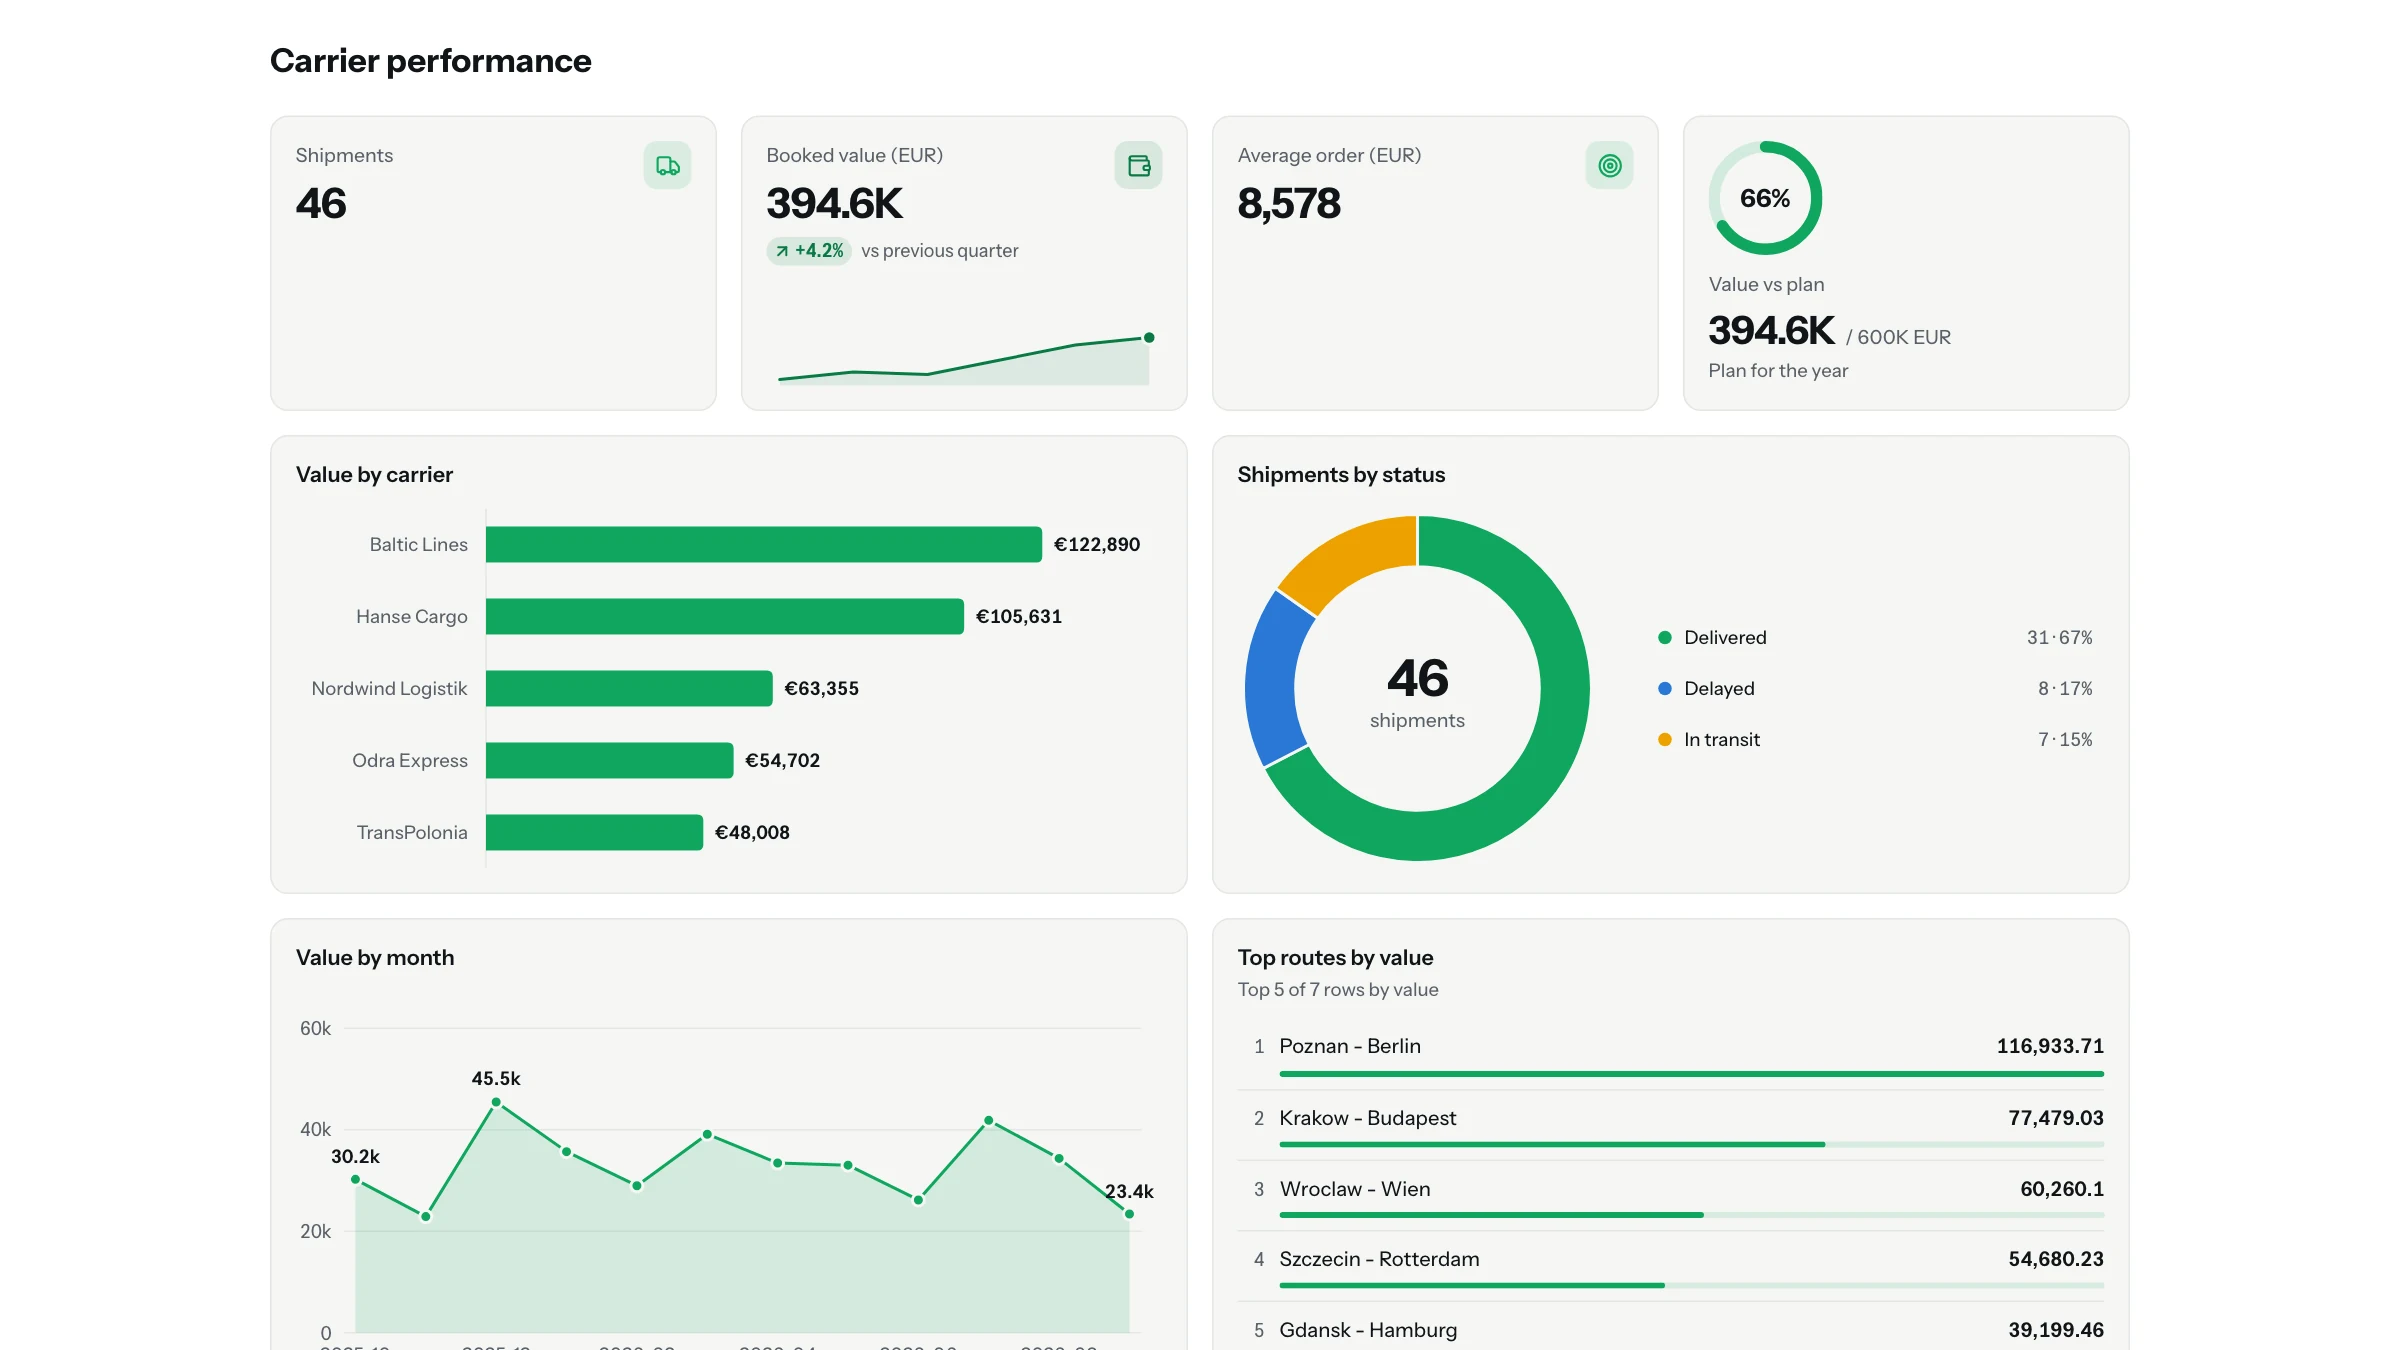
Creating a dashboard
Open the Dashboards page of a project, or the organization-wide Presentations & dashboards hub, and click Create:
- Empty dashboard: start from scratch and add widgets yourself.
- Create with AI: AI reads the table and plans the widgets. The dialog asks What should the dashboard show? This objective is optional. Write the question the dashboard should answer, for example "Delivery performance by carrier and month, late orders first", or leave the field empty.
A dashboard created with AI is built in the background. You can keep working, and it appears in the list when it is ready. Generation uses AI and counts against your organization's credit budget.
You can also ask Chat for a dashboard, or type / there and pick Generate a dashboard.
The editor
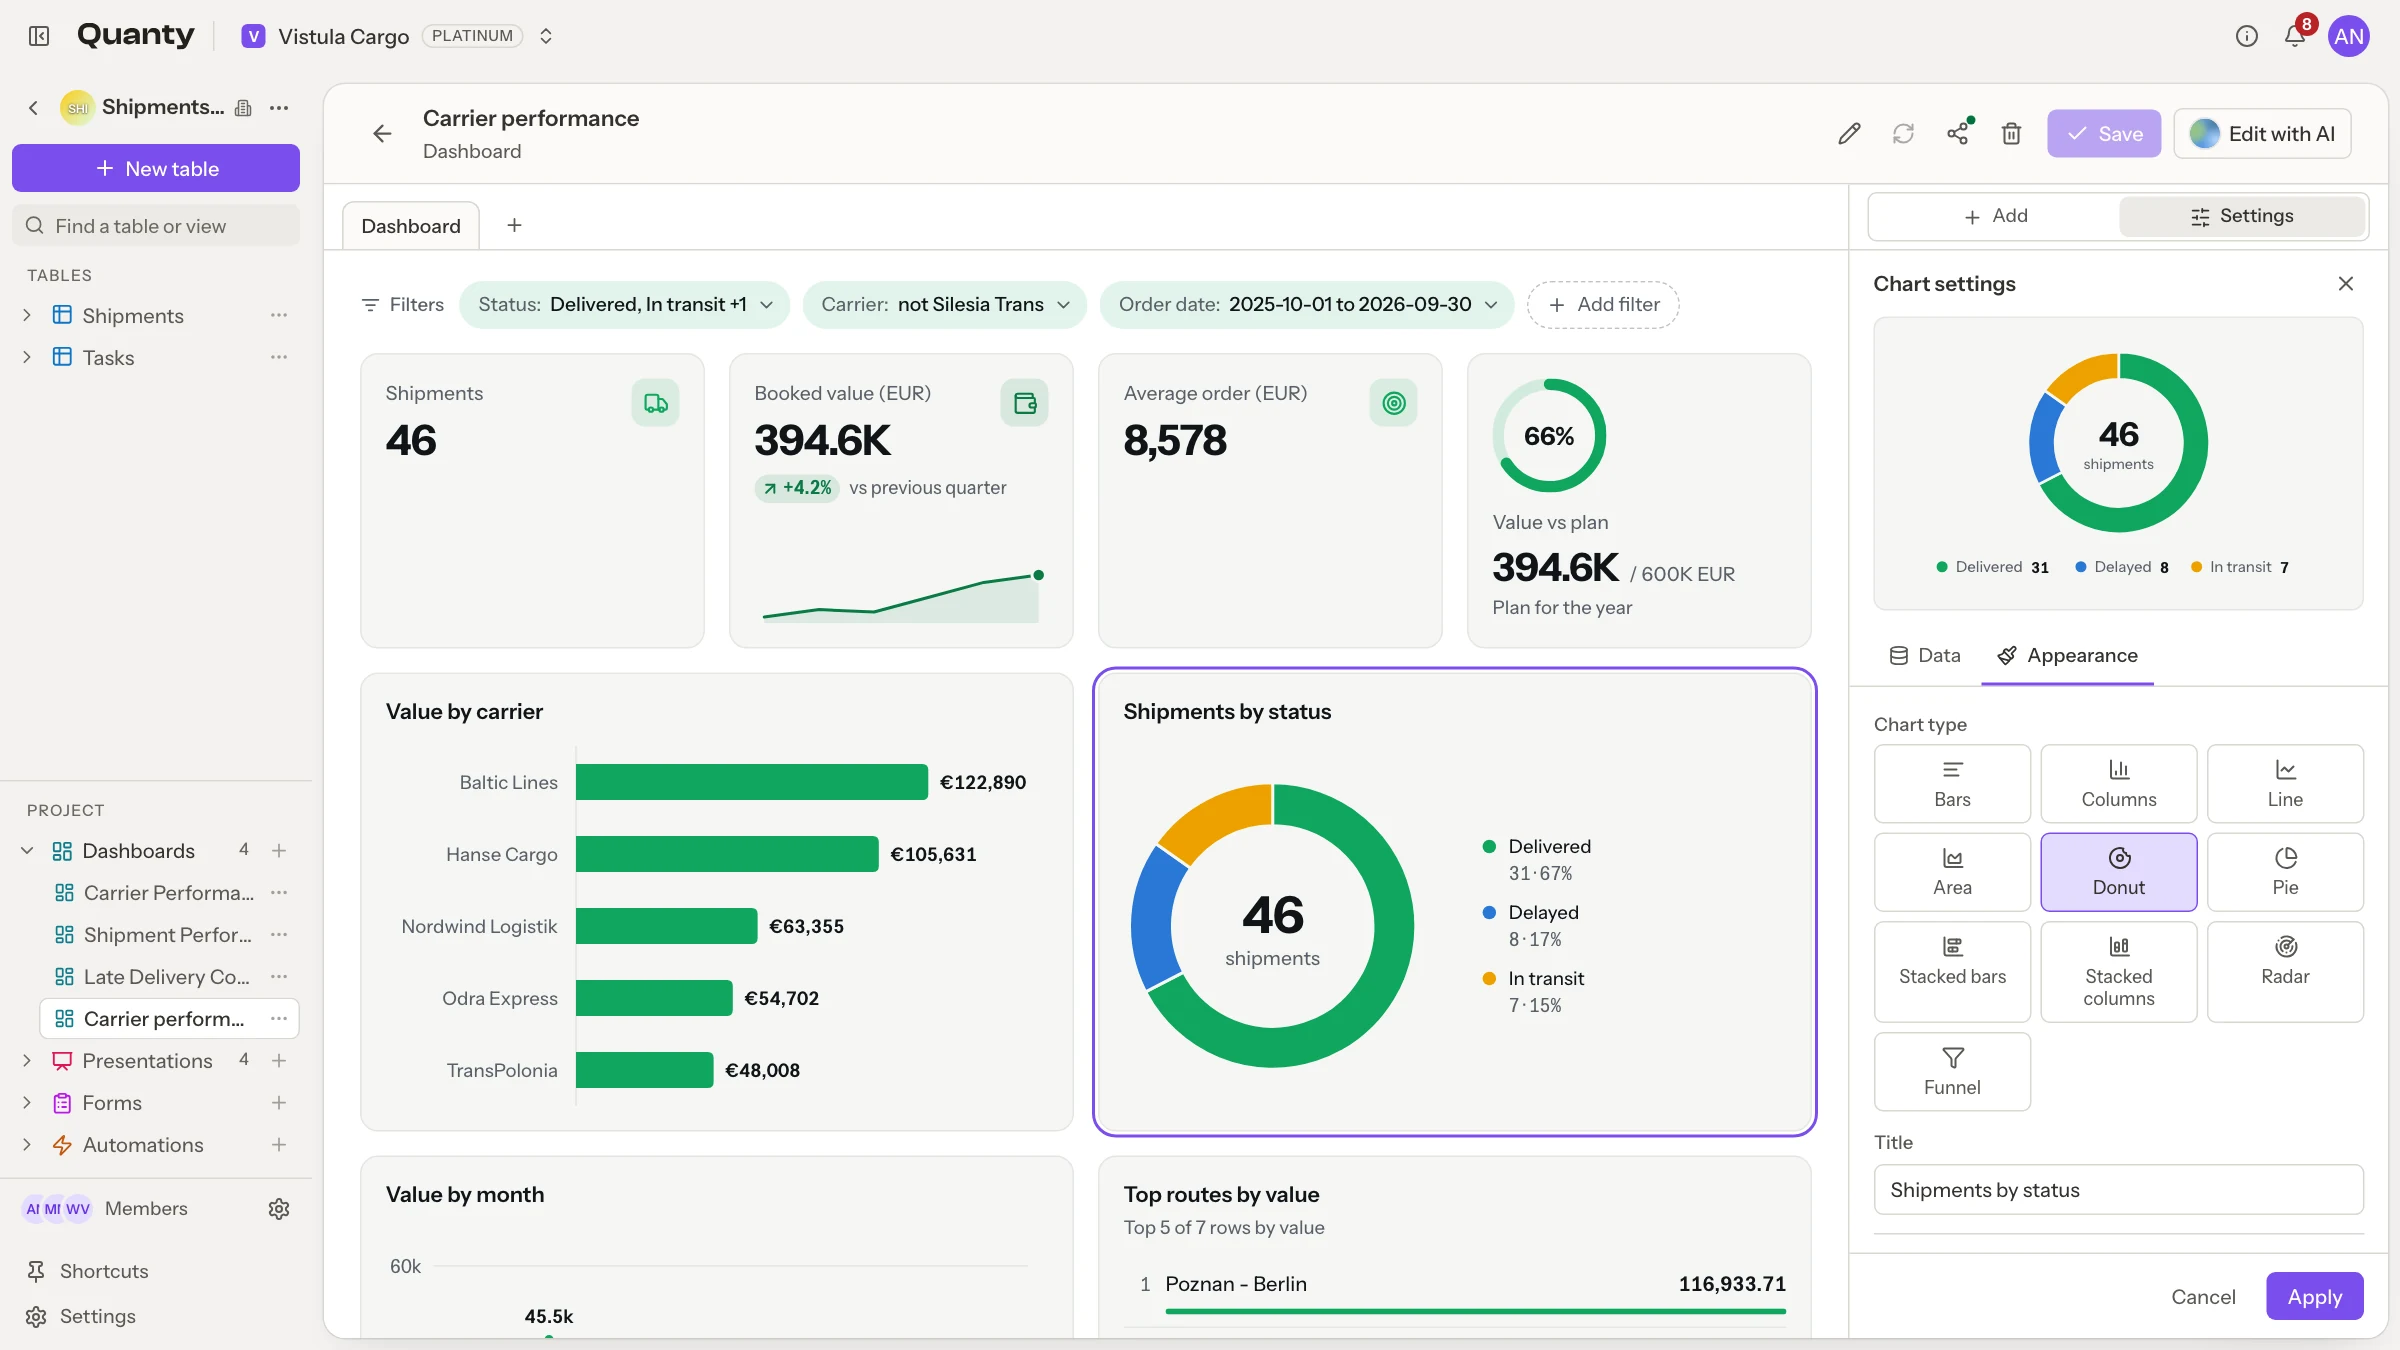
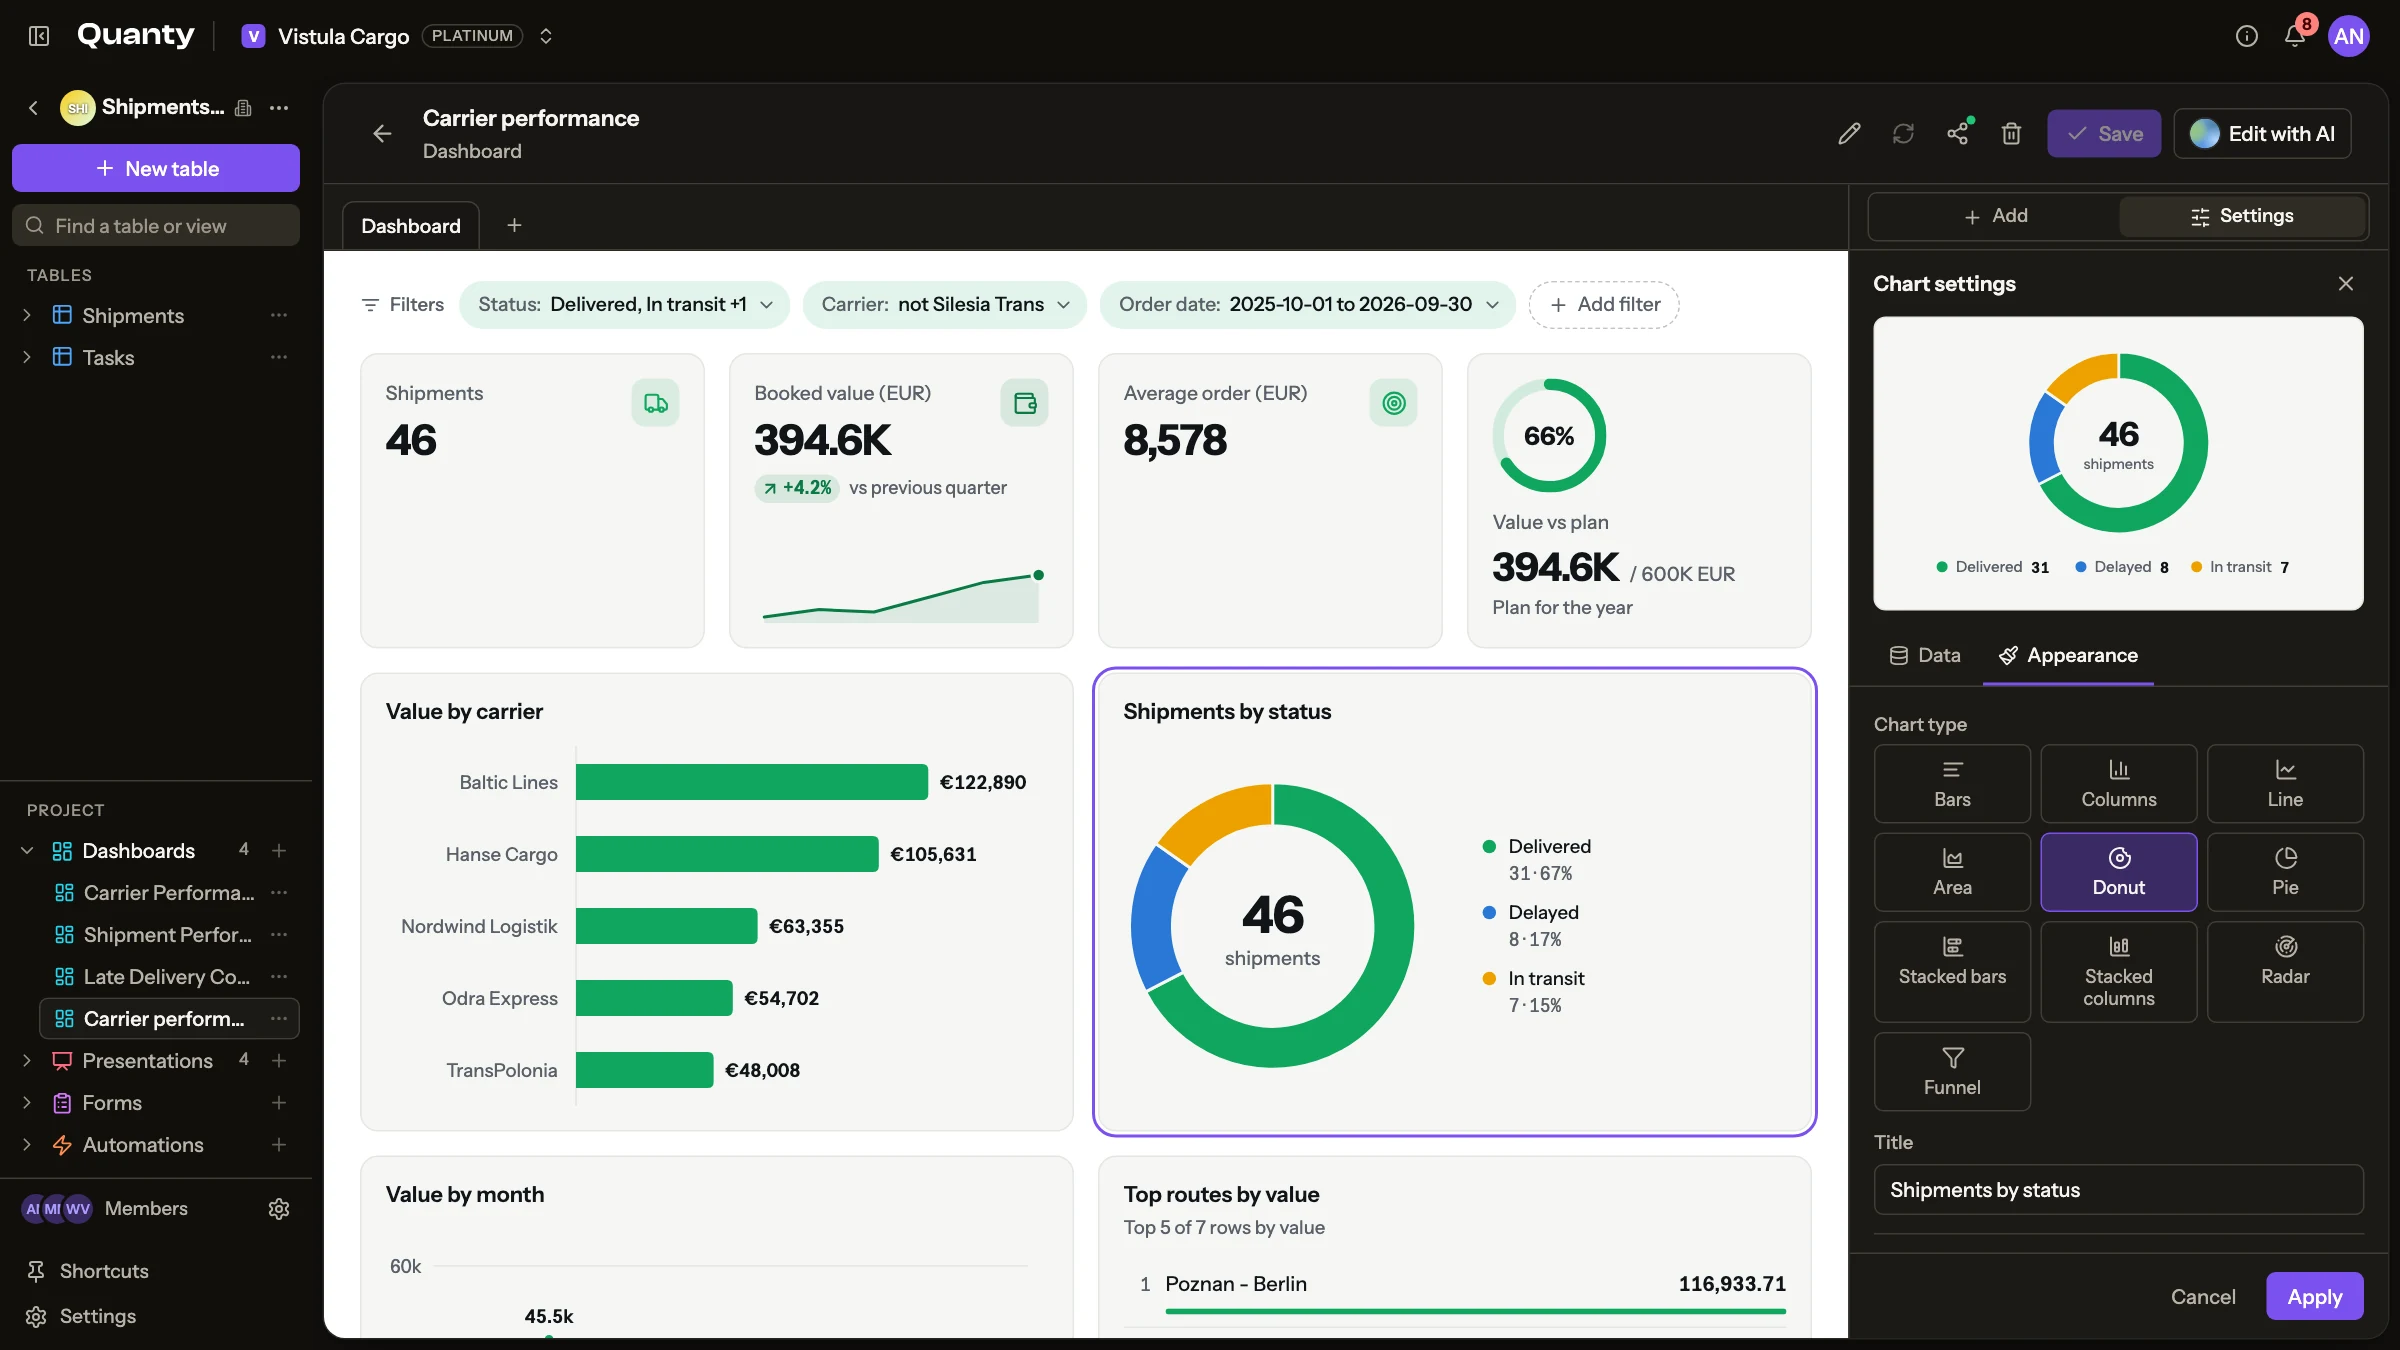
- The palette on the left groups widgets into Charts, Numbers and Content. Click a widget or drag it onto the board.
- The + between rows inserts a widget exactly there.
- Drag widgets to rearrange them. Each widget has a size: S (a quarter of a row), M (half), L (three quarters) or Full.
- Select a widget to open the settings panel with two tabs, Data and Appearance. A live preview shows the result while you edit.
Widgets
| Widget | What it shows |
|---|---|
| KPI | One number with a label. It can show the change against a previous value, a small trend line, an icon and a colour tone. |
| Chart | One of the ten chart kinds below. |
| Progress | Progress towards a target, drawn as a bar or a ring. |
| Ranked list | The top items with their values. |
| Table | Rows and columns of data. |
| Text | A note in Markdown: headings, bold, lists, links. |
| Image | A picture you upload, paste, drag in or link. See Pictures. |
| Section | A heading that groups the widgets under it. |
Chart kinds
| Chart | Good for |
|---|---|
| Bars | Comparing categories, with room for long labels |
| Columns | Comparing categories or periods side by side |
| Line | A value over time |
| Area | A value over time, with the volume visible |
| Donut | Shares of a whole. It can show the total in the centre with a caption. |
| Pie | Shares of a whole |
| Stacked bars | Categories split into two to four series |
| Stacked columns | Periods split into two to four series |
| Radar | Comparing several categories at once. It needs at least three. |
| Funnel | Steps of a process, from the largest to the smallest |
Every chart can show Value labels, turn the Legend on or off, and format its numbers as Number, Percent, Currency or Compact (1.2K), with a Unit such as kg or PLN.
Binding widgets to data
KPI, chart, progress and ranked list widgets can take their values from a table. In the Data tab, choose From the table, then pick:
- the Source table and the columns to use,
- the Aggregation: Sum, Average, Count, Minimum or Maximum,
- the Sorting and an item limit, so a chart shows the top ten instead of every row.
Bound widgets refresh from the table: Refresh data recomputes them from the latest values. Manual values are possible too. A KPI with a Manual value is useful for a target or a number that lives outside Quanty.
Filters
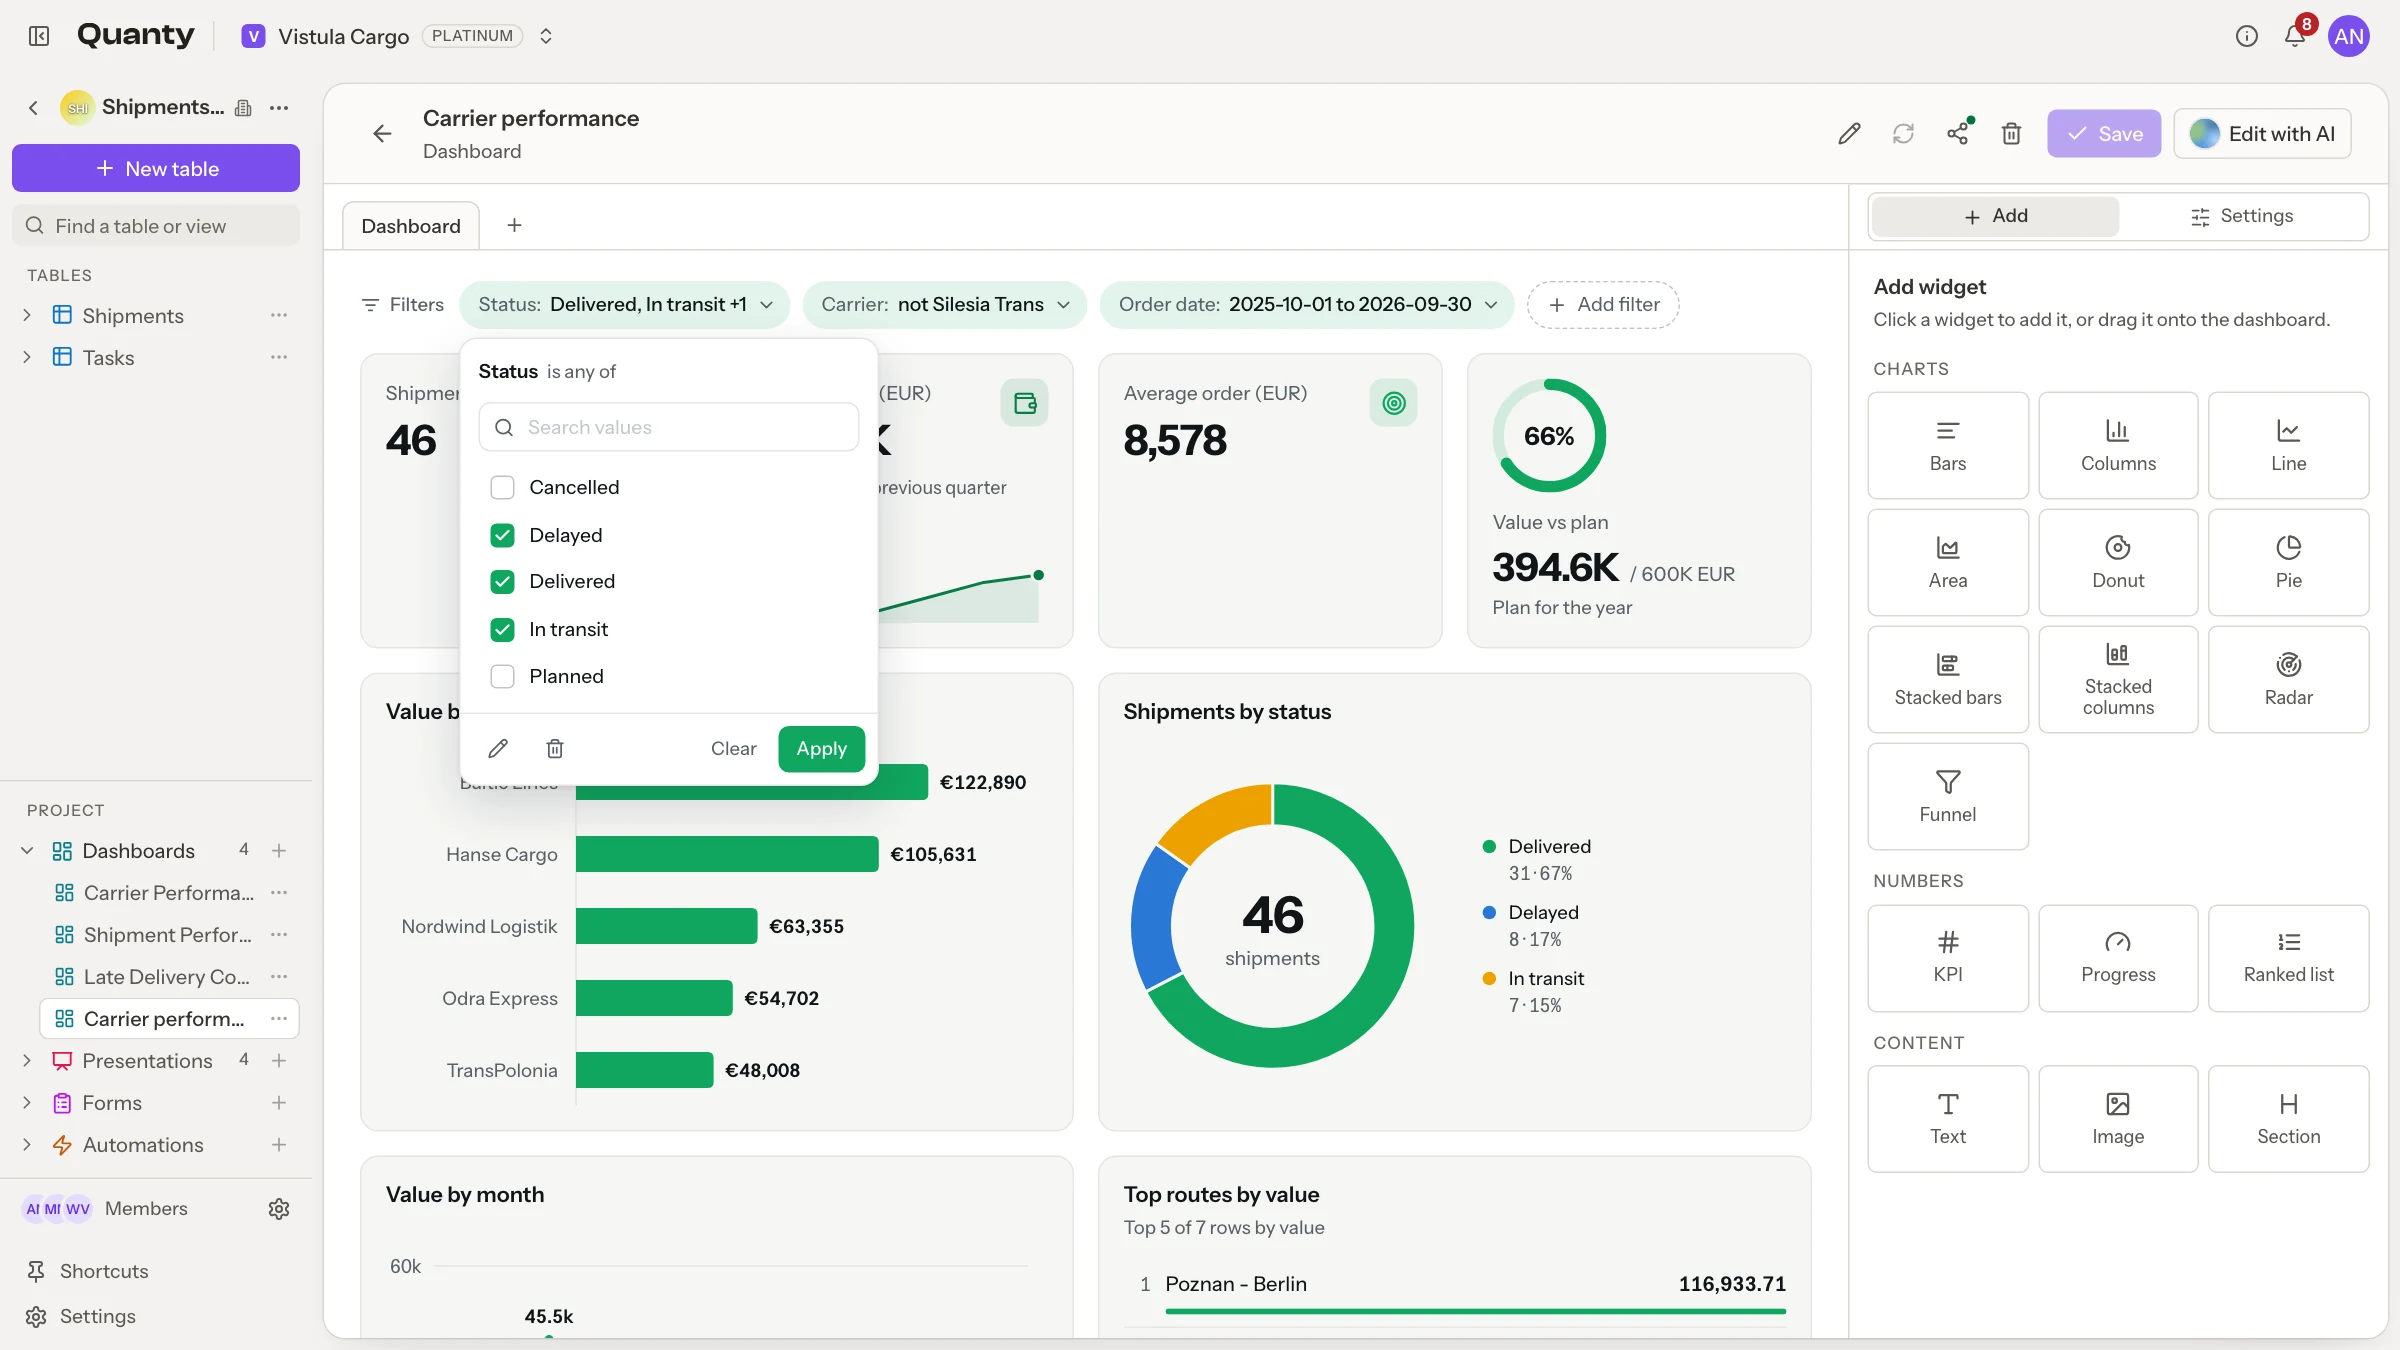
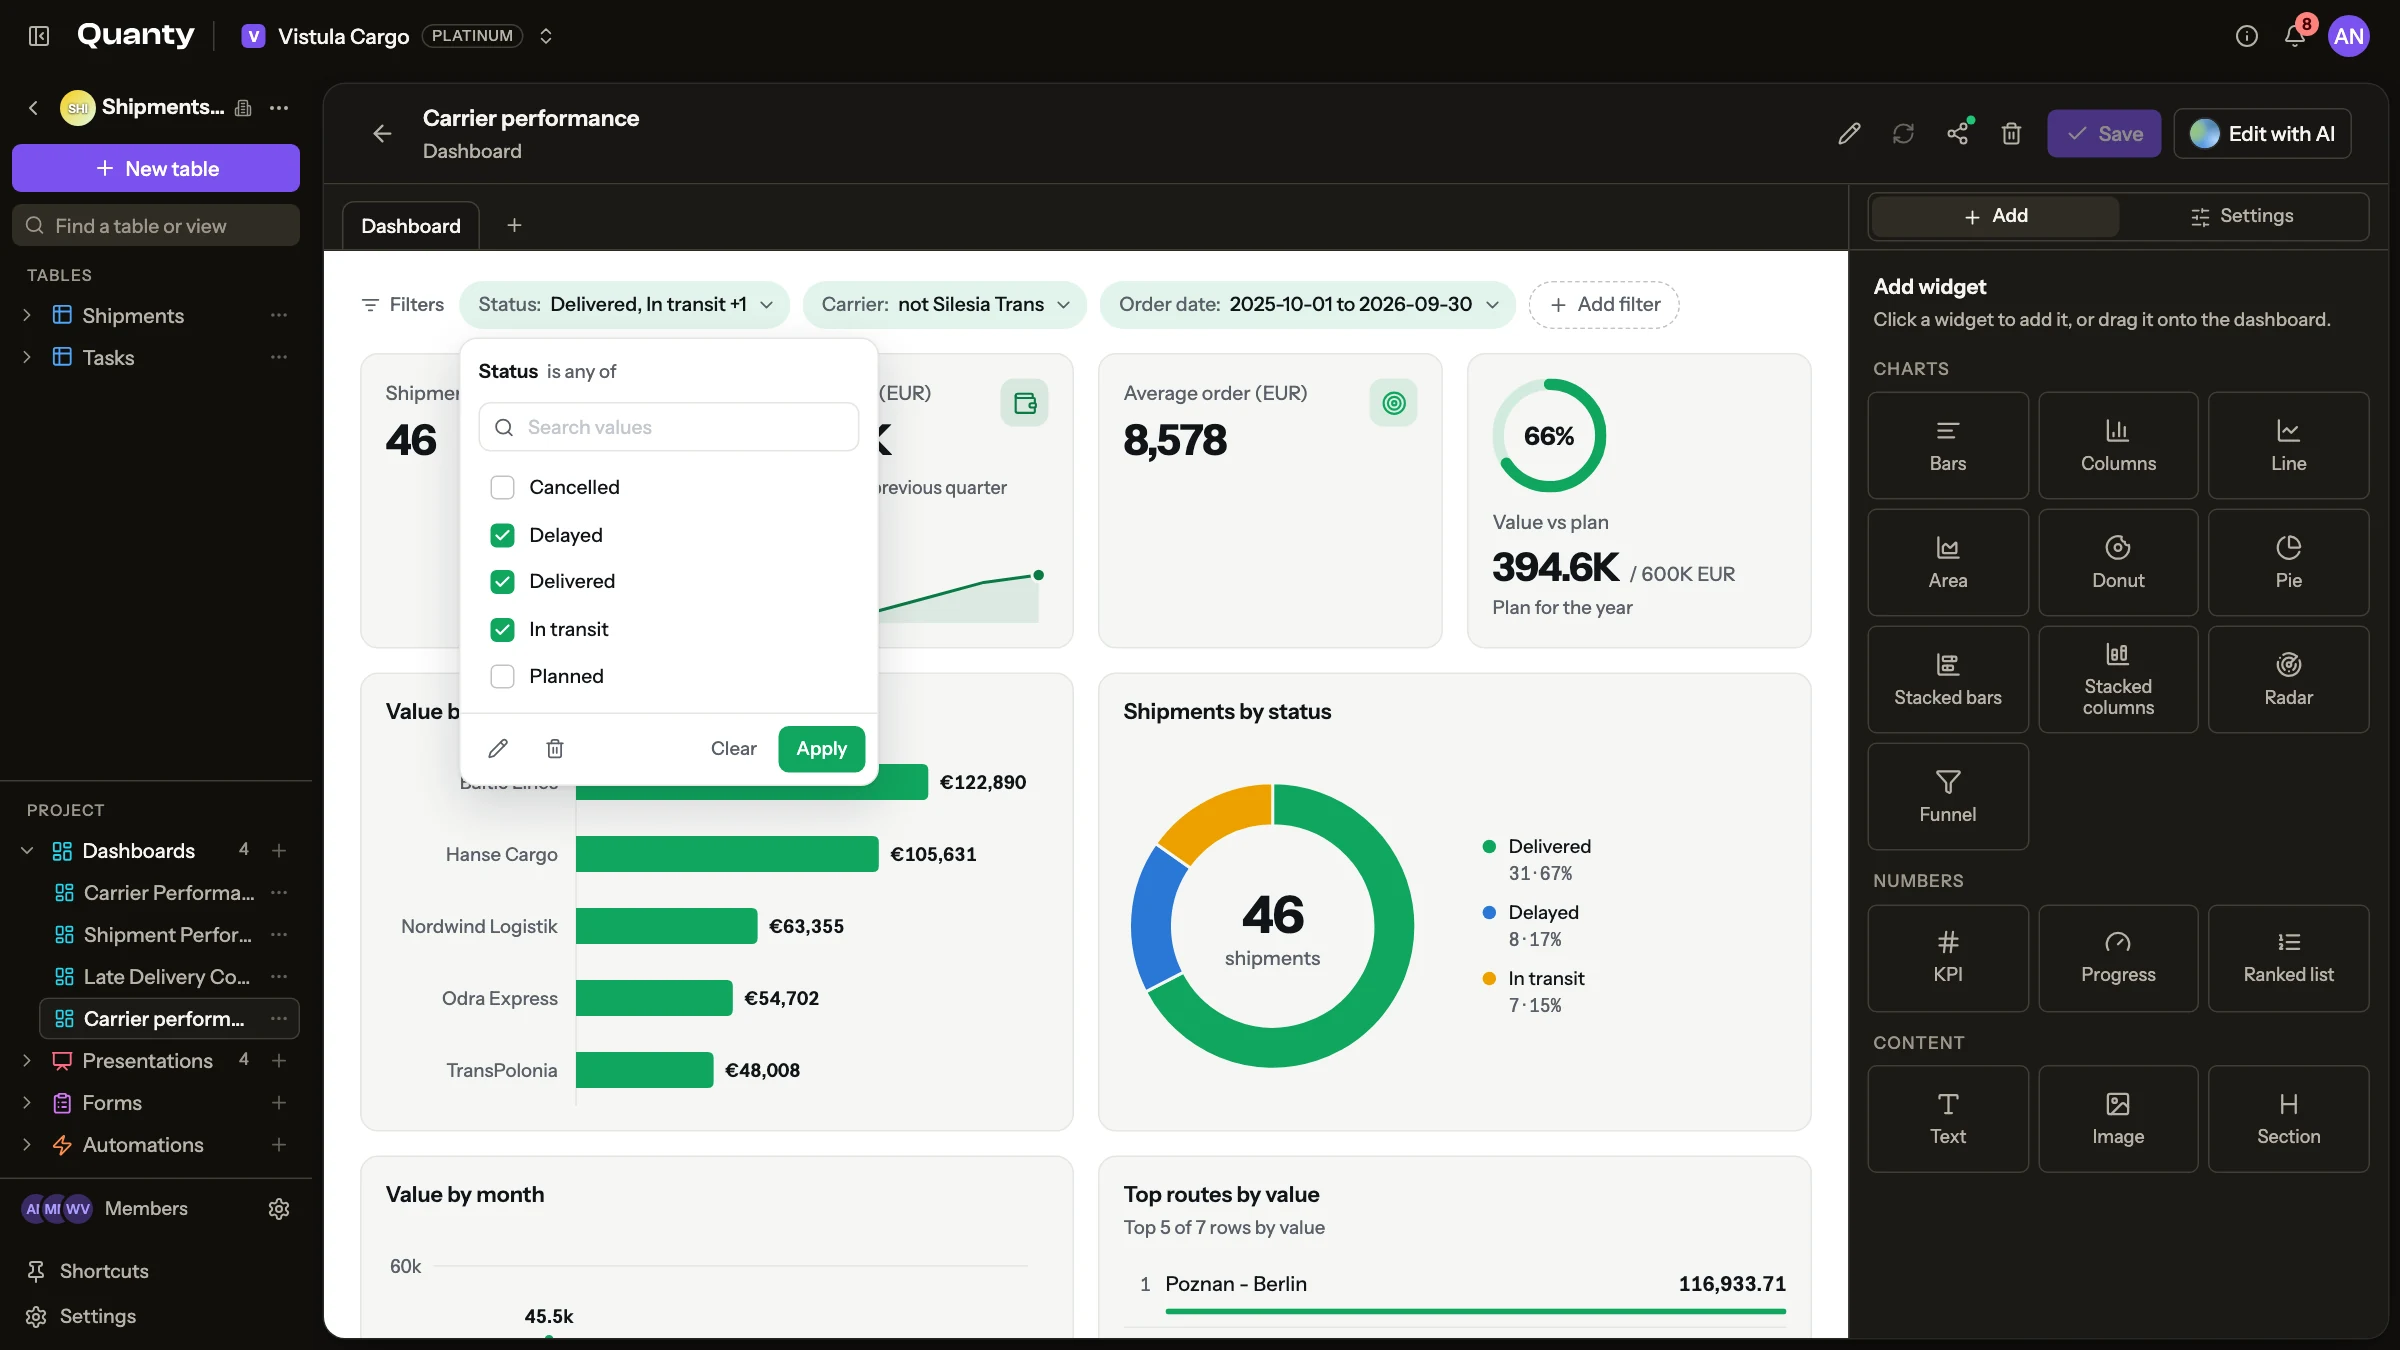
A filter narrows the whole dashboard at once: it applies to every widget built from the same table. A dashboard holds up to 6 filters. Click Add filter, choose a column and a condition:
| Condition | Matches rows where the value |
|---|---|
| is any of | is one of the chosen values |
| is none of | is not one of the chosen values |
| contains | contains the text |
| is at least | is this number or more |
| is at most | is this number or less |
| is between | lies between two numbers |
Filters are saved with the dashboard. Default values are applied every time the dashboard opens; leave them empty to start unfiltered.
What viewers can do
Anyone who opens the dashboard in Quanty can change the filter values to look at the data differently. That changes only their own view, and the saved dashboard stays as it was. Reset returns to the saved filters.
Shared links show the saved state
A public share link shows the dashboard with its saved filters, without the filter controls. To give outside readers another cut of the data, save the dashboard with different default values.
Pictures
The Image widget takes a picture in four ways: upload it, paste it, drag and drop it, or use a link. Uploads accept PNG, JPEG, GIF or WebP up to 5 MB. SVG is not supported.
Tabs
A dashboard can be split into tabs, called pages in the app: for example one for operations and one for finance. Use Add page to create one and double-click its name to rename it. Deleting a page removes the widgets on it. A dashboard holds up to 12 tabs.
Sharing
Click Share to publish the dashboard read-only:
- Choose who can open the link: Public (anyone with the link) or Organization only (signed-in members of your organization).
- Create link and copy makes the link and puts it on your clipboard. Copy link copies an existing one.
- Revoke link turns the link off. Visitors then see "This link is invalid or has been revoked."
Deleting a dashboard removes its link too. The source table is never affected.
Editing with chat
Click Edit with AI, or open chat next to the dashboard, and describe the change:
Add a funnel of orders by status, and filter the whole dashboard to this quarter.The assistant can add, change, move and remove widgets, bind them to data, set filters and change pictures. Deleting a dashboard still asks for your approval.
If the assistant changes the dashboard while you have unsaved edits in the editor, the editor tells you, and you choose between your version and Load their version.
Limits
- Up to 80 widgets and 12 tabs per dashboard.
- Up to 6 filters per dashboard.
- Pictures: PNG, JPEG, GIF or WebP up to 5 MB, no SVG.
- Shared public links show the saved state, without filter controls.
Related pages
- Presentations: slides that can embed dashboard widgets.
- Publish a live dashboard: a step-by-step recipe.
- Chat: editing the open dashboard in conversation.